You'll find the Bank's news release about the new household data here, the background paper (pdf) that goes into all the technicalities here, and the data themselves (Excel) here and here. By far the major significant improvement is the inclusion of households' equity in small and medium sized businesses (whether incorporated or not). As in many economies, it's a big slab of the economic landscape: in New Zealand households' measured wealth goes up by $312 billion when their business equity is counted. "Goes up", by the way, is meant as a matter of arithmetical comparison between the old data on household wealth and the new ones: households haven't suddenly become much richer, it's just that the RBNZ data are now measuring what was always there, whereas before they weren't.
Here's a snapshot of what New Zealand households own, from the background paper.

The business equity that is now being counted is the darkish blue segment towards the bottom. Housing makes up about half of everything (more like 60% if you add in rental property, which I'll come to in a minute). Whether you regard that as normal, or as yet another illustration of Kiwis' one-eyed preoccupation with housing an as investment, is up to you, but the good news is that, because these new RBNZ statistics are being compiled on an internationally consistent basis, we'll be in a better place to make international comparisons and judge whether we're normal or odd. It won't be a stroll in the park - "Neither the previous New Zealand household sector balance sheet data, nor this new data, will necessarily be fully comparable with data presented by authorities in other countries", as the paper says, partly because other countries have their own funny ways of counting things - but we'll be able to move a good deal closer to making reasonable judgements about how we scrub up compared to other places.
I wondered where our KiwiSavers are, and the answer is, in that purplish segment second one down, 'net equity in superannuation funds'. KiwiSaver came in in 2007, and in December '07 households' equity in super was $31 billion. By December '14 it had risen to $57.8 billion: I know there is recent research from Treasury saying KiwiSaver didn't add to overall wealth accumulation, and perhaps KiwiSaver only shifted around how wealth is held, and maybe that's right. But in any event there's now a sizeable KiwiSaver pot where there wasn't one before.
Unfortunately, one of the side effects of moving to an internationally standardised way of measuring these things is that rental property - which you and I would regard as an archetypal household asset - is classified as a business activity rather than a household activity in the international Book of Armaments. As the background paper says, "most analysts will want to include the liabilities of rental properties as household liabilities because of the full-recourse nature of mortgages in New Zealand", and so the Bank "will continue to provide statistics that include rental property as an adjunct to the new series". Jolly good.
The only quibble I've got - and I had it about the older less complete data, too - is that I think the headline way of summarising the data doesn't really show the situation in the intuitive way most of us would like to see. It's got its uses, I dare say, but it doesn't hit the spot for me. Here, for example, is one of the RBNZ's summary graphs.
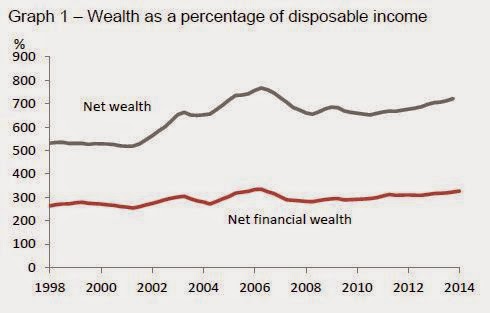
There's net wealth at the top - fine, got that, your total assets less your total liabilities, no problem there. And then there's net financial wealth, which is your financial assets (money in the bank, the KiwiSaver, those Mighty River Power shares) less your financial liabilities (the mortgage, the credit card). But I'm afraid I find the net financial wealth calculation of no practical interest or utility at all: it makes more sense to me to net off the financial liability of the mortgage against the non-financial asset of the house (to show housing equity) and to show financial assets net of any other financial liabilities.
Here's my rejig, including rental property and mortgages secured against rental property. It's horses for courses, but for me this is a better way of showing how much we've got in the house and how much in other things. Indirectly, though, it shows, again, the utility of the data, as they can be spliced and diced to suit your interest.

While a statistician's work is never done, it looks as if these enhancements to the household picture have largely filled in the one large big gap: the background picture notes some possible future extensions but I doubt if they're going to be of the order of $312 billion worth (though converting the SME equity from its current book value to market value could be worth a bob or two to the picture of household equity). We're now in a clearly better place when it comes to having a good picture of household wealth and debt - well done, the RB.
No comments:
Post a Comment
Hi - sorry about the Captcha step for real people like yourself commenting, it's to baffle the bots