Right now, the financial markets and the mainstream media have been heavily focussed on the big statistic that the BLS publishes - the monthly jobs report - and that's fair enough. So have I, in one of my day jobs as a tracker of the main macroeconomies.
But as I've got to know it a bit better I've found the JOLTS data actually gives you a much better feel for what's going on in the US labour market than the big headline jobs and unemployment numbers, and I'm beginning to think we could do with the same insight into what's going on in our own economy.
In the US, for example, in the most recent month there were some 4.6 million hires, offset by some 4.4 million 'separations', for a net employment gain around the 200K mark. 'Separations' were made up of 2.5 million 'quits' (people who voluntarily leave their jobs), 1.6 million layoffs and discharges (involuntary moves), and 0.4 million 'other' (retirements, deaths, disability etc). And yes, the numbers don't add up exactly, because of rounding, but that's the internal logic of the numbers. What the media mostly report - the net 200K gain - is actually the net resultant of giant (by comparison) gross flows, as I mentioned before in commenting on an excellent graphic display of some of these trends.
Looking at separations, here's the layoffs and discharges component. The shaded areas are recessions. There are always large numbers of layoffs, in good times and bad, because the US labour markets tend to be very flexible, but they're now way down on where they were during the worst of the GFC. Indeed they're down to the levels typically seen in pretty good times.

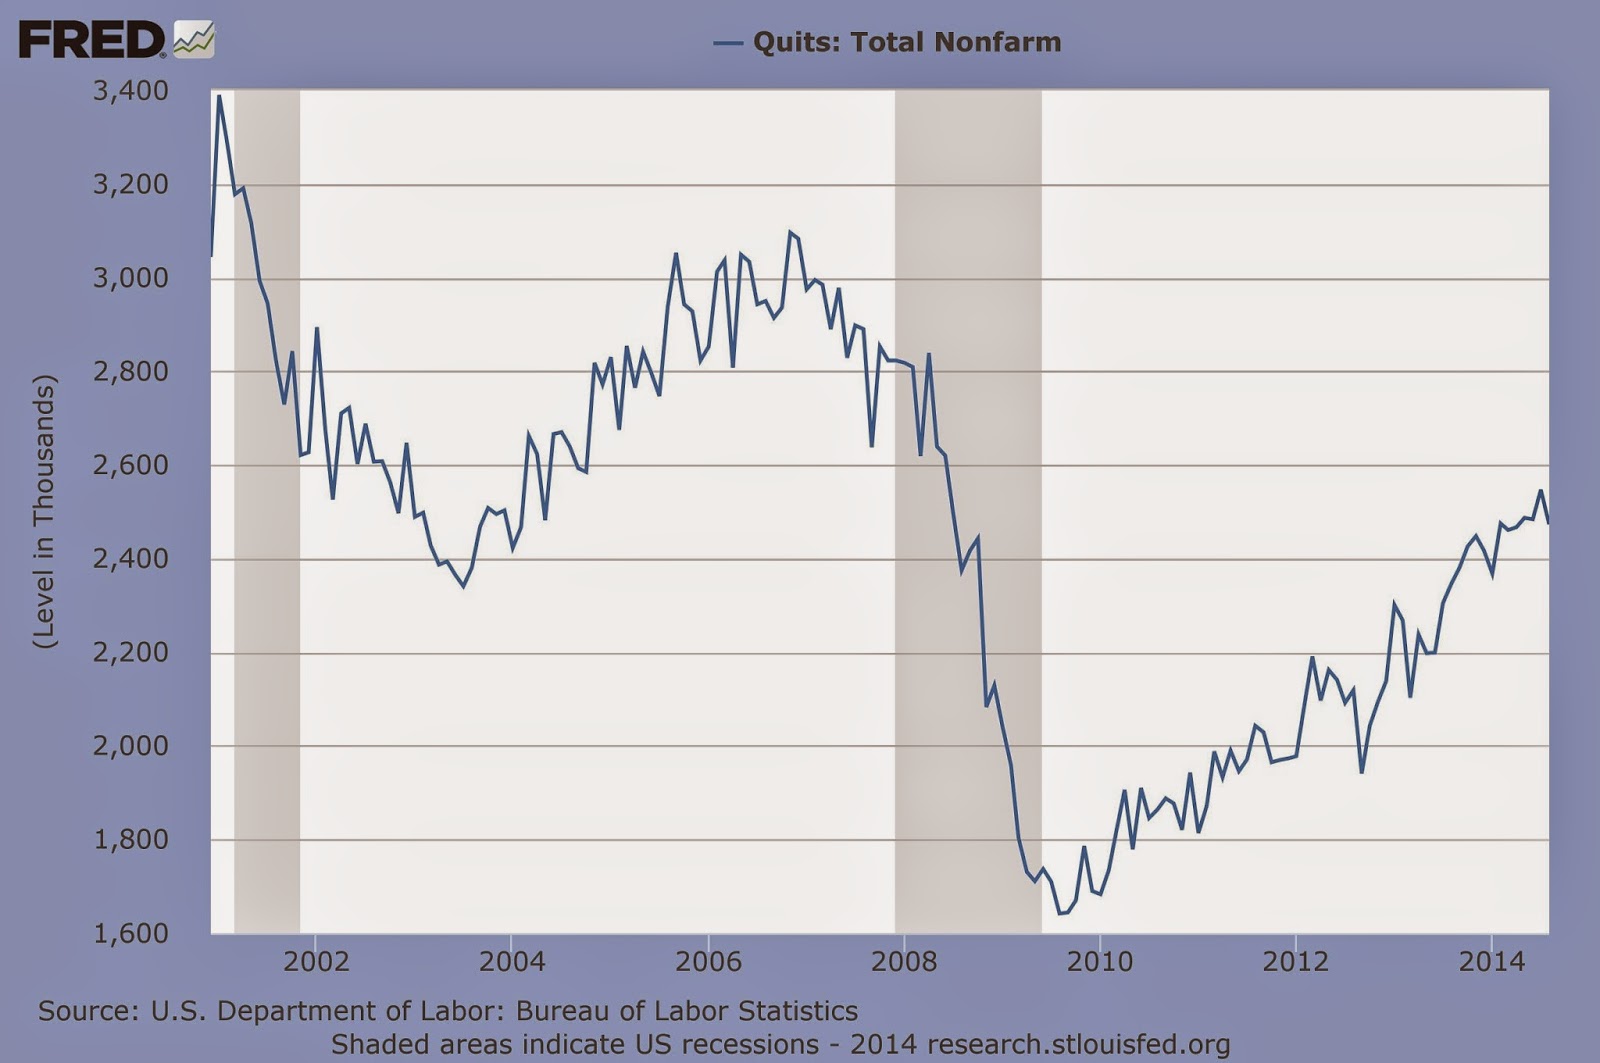
And here's what has been happening to quits. As you can see, quits drop sharply in tougher times: people are less prepared to risk leaving what they've got, plus there are fewer opportunities to move to. Interestingly, from this perspective, the US labour market hasn't yet got back to its buoyant pre-GFC level of quits.
And that's not because the opportunities aren't there. As the graph below shows, the number of job openings (red line) has actually just climbed back to its pre-GFC level. Actual hires, though (blue line), haven't quite got back there.

Overall, you'd say that this adds up to a positive picture. The haemorrhaging of layoffs has dropped to relatively low levels, and the number of job openings (which I'd take as the most forward-looking indicator in all of this) is back up at a robust level, though there seems to be some residual caution on both the employer (hires) and employee (quits) sides of the market. You don't get anything like the same degree of insight from the monthly new jobs number, or the monthly unemployment rate.
I think there's a good case for having the same sort of insight into our own labour market. I'm pretty sure that we don't have these American-style gross statistics (I did have a quick re-look at the Quarterly Employment and Household Labour Force surveys, and couldn't find them, but if I'm wrong, no doubt someone will put me right).
Yes, we know (say) what the total number of filled jobs was each quarter, so we know what the change in jobs was from one quarter to the next. But we don't know if a 10,000 increase in jobs was down to 10,000 hires, no quits, no sackings, or 100,000 hires, 60,000 quits and 30,000 layoffs. And I'm not sure you can make a good enough fist of either tracking the economic cycle or devising labour market policy without some clearer sighting of those gross flows.
We're even more in the dark on job openings (in US terminology) or vacancies (ours). That's not to knock MBIE's vacancies index (latest reading shown below), which is a useful macroeconomic indicator in its own right. But it's an index, of the main online job ads only, and not the sort of 'ask the employers directly' numbers the US collects.

I'm just about the last person who'd wish an extra or unnecessary burden on Stats - I've been up close and personal with them for a long time, and I know the pressures on resources - but I'm starting to think we could do with better tracking of the dynamics of our labour market. And we could probably do it cheaper than the Americans do, as we're more adept at re-using 'administrative data' (like the IRD's) that's been collected already for other reasons (the Americans use a separate standalone survey).
As it happens, it looks as if Stats think so, too. I dug out Stats' list of the important Tier 1 statistics (background here, list itself here as a pdf). 'Job and worker turnover' is listed as a currently produced Tier 1 statistic, though I'm not sure the 'turnover' part is comprehensive and I reckon this could usefully be expanded on JOLTS lines. MBIE's vacancies index was recently made a Tier 1 statistic, but is not yet anything like a full headcount of job openings. And layoffs, unfortunately, is on the long finger: 'redundancies' is at the research stage, with no decision thus far on how often the data might be collected, or when the exercise might start.
In sum, we know that the JOLTS data give us much better understanding of the US economy; we can be pretty sure they'd do the same for us if we had their equivalents; and we've agreed that they should be on the Tier 1 list. Maybe time to get on with it?
No comments:
Post a Comment
Hi - sorry about the Captcha step for real people like yourself commenting, it's to baffle the bots