No sooner had I posted about some promising 'dashboards' from Sense Partners and the Treasury, which aim to use a variety of data to try and gauge exactly where economic activity has got to through lockdown, than Stats also came to the party with its own data portal (media release here, portal itself here).
It's excellent. They've even found a data sources I'd never heard of, and I've played around with quite a few. It's from the GDELT Project, showing weekly economic sentiment (it's in the 'Economic'/'Confidence' section). I'm not sure whether it's New Zealand specific or global, but either way it's informative.
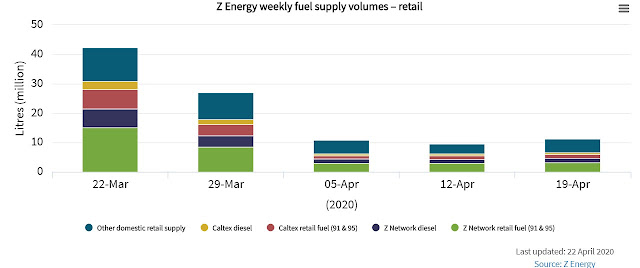
Here's Z's weekly fuel sales (in 'Economic'/'Activity'): hat-tip to them for sharing.
Gift horses and mouths and so on, but if the portal could organise some weekly (or even daily) electronic card expenditure data, that would be a useful extension to what is already a good (and easy to use) data set.
Stats says all the right things about the data being other peoples', not theirs, and go look up the methodology of the original creators if you want to find out more about what they mean and how they've been created.
All good stuff - and let's hope that on the other side of covid, Stats give some thought (and Treasury gives some money) to a permanent improvement in our ability to keep our finger on the day to day pulse of the economy.


No comments:
Post a Comment
Hi - sorry about the Captcha step for real people like yourself commenting, it's to baffle the bots